TFBS_DB_186
Bicluster Network Summary
Legend:
= Somatically mutated gene/pathway = TF; = miRNA; (Regulator edges: = Activation; T = Repression)
= Bicluster
= Hallmark of Cancer
= Somatically mutated gene/pathway = TF; = miRNA; (Regulator edges: = Activation; T = Repression)
= Bicluster
= Hallmark of Cancer
Summary
| Bicluster Expression of Patient Tumors
Expression of genes from patient tumors in bicluster on left side of red dashed line and out of bicluster on right of red dashed line. Each patient tumor is represented as a boxplot, ordered by their median expression for the bicluster genes (smallest to largest) and colored according to it's GBM subtype. |
Enrichment of Tumor Subtypes in Qunitiles
Patient tumors are sorted as on the left and broken into quintiles following the dashed grey lines. Then each quintile is tested for enrichment of each tumor subtype. The deviation from zero indicate -log10(enrichment p-value), and positive values indicate over-enrichment and negative values underenrichment. |
| Genes | Patient Tumors | FPC Var. Exp. (Perm. p-value) | Survival (p-value) | Independent Replication |
|---|---|---|---|---|
| 39 | 416 | 0.63 (0.0E+00) |
2.55 (1.1E-02) |
Co-expression Survival |
| Regulators | Causal Flows | Enriched GO BPs | Enriched Hallmarks of Cancer |
|---|---|---|---|
| 2 | 4 | 36 | 4 |
Replication in independent datasets
| Study | FPC Var. Exp. (Perm. p-value) | Survival (p-value) |
|---|---|---|
| Gravendeel, et al. 2009 | 0.61 (0.0E+00) | 2.61 (9.2E-03) |
| Madhavan, et al. 2009 | 0.61 (0.0E+00) | 1.79 (7.3E-02) |
| Murat, et al. 2008 | 0.58 (0.0E+00) | -1.25 (2.1E-01) |
Genes
Patients
- TCGA.02.0001
- TCGA.02.0003
- TCGA.02.0004
- TCGA.02.0006
- TCGA.02.0007
- TCGA.02.0009
- TCGA.02.0010
- TCGA.02.0011
- TCGA.02.0014
- TCGA.02.0015
- TCGA.02.0016
- TCGA.02.0021
- TCGA.02.0023
- TCGA.02.0024
- TCGA.02.0025
- TCGA.02.0026
- TCGA.02.0027
- TCGA.02.0028
- TCGA.02.0033
- TCGA.02.0034
- TCGA.02.0037
- TCGA.02.0038
- TCGA.02.0039
- TCGA.02.0043
- TCGA.02.0046
- TCGA.02.0047
- TCGA.02.0048
- TCGA.02.0051
- TCGA.02.0052
- TCGA.02.0054
- TCGA.02.0055
- TCGA.02.0057
- TCGA.02.0058
- TCGA.02.0059
- TCGA.02.0060
- TCGA.02.0064
- TCGA.02.0068
- TCGA.02.0069
- TCGA.02.0070
- TCGA.02.0071
- TCGA.02.0074
- TCGA.02.0075
- TCGA.02.0079
- TCGA.02.0080
- TCGA.02.0083
- TCGA.02.0085
- TCGA.02.0086
- TCGA.02.0089
- TCGA.02.0099
- TCGA.02.0102
- TCGA.02.0104
- TCGA.02.0107
- TCGA.02.0113
- TCGA.02.0114
- TCGA.02.0115
- TCGA.02.0116
- TCGA.02.0289
- TCGA.02.0321
- TCGA.02.0330
- TCGA.02.0332
- TCGA.02.0337
- TCGA.02.0422
- TCGA.02.0430
- TCGA.02.0432
- TCGA.02.0440
- TCGA.02.0446
- TCGA.02.2466
- TCGA.02.2470
- TCGA.02.2483
- TCGA.02.2485
- TCGA.02.2486
- TCGA.06.0122
- TCGA.06.0124
- TCGA.06.0125
- TCGA.06.0126
- TCGA.06.0128
- TCGA.06.0129
- TCGA.06.0130
- TCGA.06.0132
- TCGA.06.0133
- TCGA.06.0137
- TCGA.06.0138
- TCGA.06.0139
- TCGA.06.0140
- TCGA.06.0141
- TCGA.06.0142
- TCGA.06.0143
- TCGA.06.0145
- TCGA.06.0146
- TCGA.06.0148
- TCGA.06.0150
- TCGA.06.0151
- TCGA.06.0152
- TCGA.06.0154
- TCGA.06.0155
- TCGA.06.0156
- TCGA.06.0157
- TCGA.06.0158
- TCGA.06.0159
- TCGA.06.0160
- TCGA.06.0165
- TCGA.06.0166
- TCGA.06.0167
- TCGA.06.0168
- TCGA.06.0169
- TCGA.06.0171
- TCGA.06.0173
- TCGA.06.0174
- TCGA.06.0176
- TCGA.06.0178
- TCGA.06.0184
- TCGA.06.0185
- TCGA.06.0187
- TCGA.06.0188
- TCGA.06.0189
- TCGA.06.0190
- TCGA.06.0192
- TCGA.06.0195
- TCGA.06.0197
- TCGA.06.0206
- TCGA.06.0208
- TCGA.06.0209
- TCGA.06.0210
- TCGA.06.0211
- TCGA.06.0213
- TCGA.06.0214
- TCGA.06.0216
- TCGA.06.0219
- TCGA.06.0221
- TCGA.06.0237
- TCGA.06.0238
- TCGA.06.0240
- TCGA.06.0241
- TCGA.06.0394
- TCGA.06.0409
- TCGA.06.0644
- TCGA.06.0649
- TCGA.06.0650
- TCGA.06.0673
- TCGA.06.0675
- TCGA.06.0676
- TCGA.06.0678
- TCGA.06.0681
- TCGA.06.0686
- TCGA.06.0743
- TCGA.06.0744
- TCGA.06.0745
- TCGA.06.0747
- TCGA.06.0749
- TCGA.06.0750
- TCGA.06.0875
- TCGA.06.0876
- TCGA.06.0877
- TCGA.06.0878
- TCGA.06.0879
- TCGA.06.0881
- TCGA.06.0882
- TCGA.06.1084
- TCGA.06.1086
- TCGA.06.1087
- TCGA.06.1800
- TCGA.06.1801
- TCGA.06.1802
- TCGA.06.1804
- TCGA.06.1805
- TCGA.06.2557
- TCGA.06.2558
- TCGA.06.2559
- TCGA.06.2561
- TCGA.06.2562
- TCGA.06.2563
- TCGA.06.2564
- TCGA.06.2565
- TCGA.06.2566
- TCGA.06.2567
- TCGA.06.2569
- TCGA.06.2570
- TCGA.06.5412
- TCGA.06.5414
- TCGA.06.5415
- TCGA.06.5417
- TCGA.06.5418
- TCGA.06.5856
- TCGA.06.5859
- TCGA.06.6388
- TCGA.06.6390
- TCGA.06.6695
- TCGA.06.6697
- TCGA.06.6698
- TCGA.06.6699
- TCGA.06.6701
- TCGA.08.0244
- TCGA.08.0245
- TCGA.08.0246
- TCGA.08.0344
- TCGA.08.0346
- TCGA.08.0347
- TCGA.08.0348
- TCGA.08.0350
- TCGA.08.0351
- TCGA.08.0353
- TCGA.08.0354
- TCGA.08.0355
- TCGA.08.0356
- TCGA.08.0357
- TCGA.08.0359
- TCGA.08.0360
- TCGA.08.0380
- TCGA.08.0385
- TCGA.08.0389
- TCGA.08.0390
- TCGA.08.0392
- TCGA.08.0510
- TCGA.08.0512
- TCGA.08.0517
- TCGA.08.0524
- TCGA.08.0623
- TCGA.08.0625
- TCGA.08.0626
- TCGA.08.0627
- TCGA.12.0616
- TCGA.12.0618
- TCGA.12.0619
- TCGA.12.0620
- TCGA.12.0653
- TCGA.12.0654
- TCGA.12.0656
- TCGA.12.0657
- TCGA.12.0662
- TCGA.12.0670
- TCGA.12.0688
- TCGA.12.0691
- TCGA.12.0692
- TCGA.12.0703
- TCGA.12.0707
- TCGA.12.0769
- TCGA.12.0772
- TCGA.12.0773
- TCGA.12.0775
- TCGA.12.0776
- TCGA.12.0778
- TCGA.12.0780
- TCGA.12.0818
- TCGA.12.0819
- TCGA.12.0820
- TCGA.12.0821
- TCGA.12.0822
- TCGA.12.0826
- TCGA.12.0827
- TCGA.12.0828
- TCGA.12.0829
- TCGA.12.1088
- TCGA.12.1089
- TCGA.12.1090
- TCGA.12.1091
- TCGA.12.1092
- TCGA.12.1093
- TCGA.12.1094
- TCGA.12.1095
- TCGA.12.1097
- TCGA.12.1098
- TCGA.12.1099
- TCGA.12.1599
- TCGA.12.1600
- TCGA.12.1602
- TCGA.12.3646
- TCGA.12.3649
- TCGA.12.5295
- TCGA.14.0736
- TCGA.14.0781
- TCGA.14.0783
- TCGA.14.0787
- TCGA.14.0789
- TCGA.14.0790
- TCGA.14.0812
- TCGA.14.0813
- TCGA.14.0817
- TCGA.14.0865
- TCGA.14.0867
- TCGA.14.0871
- TCGA.14.1034
- TCGA.14.1037
- TCGA.14.1043
- TCGA.14.1396
- TCGA.14.1401
- TCGA.14.1402
- TCGA.14.1450
- TCGA.14.1451
- TCGA.14.1452
- TCGA.14.1453
- TCGA.14.1454
- TCGA.14.1456
- TCGA.14.1458
- TCGA.14.1459
- TCGA.14.1827
- TCGA.14.1829
- TCGA.14.2554
- TCGA.14.3476
- TCGA.14.4157
- TCGA.15.0742
- TCGA.15.1446
- TCGA.15.1447
- TCGA.15.1449
- TCGA.16.0846
- TCGA.16.0848
- TCGA.16.0849
- TCGA.16.0850
- TCGA.16.0861
- TCGA.16.1045
- TCGA.16.1047
- TCGA.16.1055
- TCGA.16.1056
- TCGA.16.1060
- TCGA.16.1062
- TCGA.16.1063
- TCGA.19.0955
- TCGA.19.0957
- TCGA.19.0960
- TCGA.19.0963
- TCGA.19.0964
- TCGA.19.1387
- TCGA.19.1390
- TCGA.19.1392
- TCGA.19.1787
- TCGA.19.1790
- TCGA.19.1791
- TCGA.19.2619
- TCGA.19.2625
- TCGA.19.2629
- TCGA.19.2631
- TCGA.19.5947
- TCGA.19.5951
- TCGA.19.5953
- TCGA.19.5954
- TCGA.19.5955
- TCGA.19.5956
- TCGA.19.5959
- TCGA.26.1438
- TCGA.26.1439
- TCGA.26.1440
- TCGA.26.1442
- TCGA.26.1443
- TCGA.26.5133
- TCGA.26.5134
- TCGA.26.5135
- TCGA.26.5136
- TCGA.26.5139
- TCGA.26.6173
- TCGA.27.1833
- TCGA.27.1836
- TCGA.27.1837
- TCGA.27.1838
- TCGA.27.2518
- TCGA.27.2519
- TCGA.27.2521
- TCGA.27.2523
- TCGA.27.2526
- TCGA.27.2527
- TCGA.27.2528
- TCGA.28.1745
- TCGA.28.1746
- TCGA.28.1747
- TCGA.28.1751
- TCGA.28.1753
- TCGA.28.1755
- TCGA.28.1756
- TCGA.28.2506
- TCGA.28.2509
- TCGA.28.2510
- TCGA.28.2513
- TCGA.28.2514
- TCGA.28.5208
- TCGA.28.5209
- TCGA.28.5213
- TCGA.28.5214
- TCGA.28.5220
- TCGA.28.6450
- TCGA.32.1970
- TCGA.32.1973
- TCGA.32.1986
- TCGA.32.1987
- TCGA.32.1991
- TCGA.32.2491
- TCGA.32.2494
- TCGA.32.2495
- TCGA.32.2615
- TCGA.32.4208
- TCGA.32.4209
- TCGA.32.4210
- TCGA.32.4211
- TCGA.32.4719
- TCGA.41.2572
- TCGA.41.2573
- TCGA.41.2575
- TCGA.41.3393
- TCGA.41.3915
- TCGA.41.4097
- TCGA.41.5651
- TCGA.74.6573
- TCGA.74.6575
- TCGA.74.6578
- TCGA.76.4925
- TCGA.76.4927
- TCGA.76.4932
- TCGA.76.4934
- TCGA.76.4935
- TCGA.76.6191
- TCGA.76.6282
- TCGA.76.6286
- TCGA.76.6657
- TCGA.76.6660
- TCGA.76.6661
- TCGA.76.6664
- TCGA.81.5910
- TCGA.81.5911
- TCGA.87.5896
Causal Flows
| Mutation | Regulator | Bicluster | ||
|---|---|---|---|---|
| NEUROTROPHIC_FACTOR_MEDIATED_TRK_RECEPTOR_SIGNALING | ELF1 | TFBS_DB_186 | ||
| PIK3CA | IRF1 | TFBS_DB_186 | ||
| REELIN_SIGNALING_PATHWAY | IRF1 | TFBS_DB_186 | ||
| SIGNALING_EVENTS_MEDIATED_BY_THE_HEDGEHOG_FAMILY | ELF1 | TFBS_DB_186 |
Enriched GO Biological Processes
| GO Term | GO BP ID | Genes |
| Cell activation | GO:0001775 | |
| Immune system process | GO:0002376 | |
| Regulation of immune system process | GO:0002682 | |
| Regulation of leukocyte activation | GO:0002694 | |
| Immune response-activating signal transduction | GO:0002757 | |
| Response to stress | GO:0006950 | |
| Defense response | GO:0006952 | CSF3R LILRA2 LILRA3 WAS |
| Inflammatory response | GO:0006954 | AIF1 AOAH C3AR1 IL18 LY86 |
| Immune response | GO:0006955 | CD4 CD86 FCGR1A IL18 LST1 WAS |
| Signal transduction | GO:0007165 | APBB1IP CD4 CSF3R FCGR1A FPR1 IFNGR1 LILRA2 LILRA3 TYROBP |
| Response to wounding | GO:0009611 | |
| Interleukin-2 production | GO:0032623 | |
| Regulation of superoxide anion generation | GO:0032928 | SYK |
| Cytokine biosynthetic process | GO:0042089 | |
| Interleukin-2 biosynthetic process | GO:0042094 | IL18 |
| Cytokine metabolic process | GO:0042107 | |
| T cell activation | GO:0042110 | CD86 WAS |
| Positive regulation of catalytic activity | GO:0043085 | |
| Positive regulation of interleukin-2 biosynthetic process | GO:0045086 | CD4 CD86 |
| Innate immune response | GO:0045087 | CD4 CD86 FCGR1A LY86 PSMB10 SYK TYROBP WAS |
| Leukocyte activation | GO:0045321 | |
| Regulation of alpha-beta t cell activation | GO:0046634 | |
| Positive regulation of alpha-beta t cell activation | GO:0046635 | |
| Lymphocyte activation | GO:0046649 | |
| Regulation of response to stimulus | GO:0048583 | |
| Regulation of immune response | GO:0050776 | FCGR1A HCST TYROBP |
| Regulation of biological process | GO:0050789 | |
| Regulation of calcium-mediated signaling | GO:0050848 | |
| Regulation of t cell activation | GO:0050863 | CD4 |
| Regulation of cell activation | GO:0050865 | |
| Positive regulation of cell activation | GO:0050867 | |
| Positive regulation of t cell activation | GO:0050870 | |
| Response to stimulus | GO:0050896 | |
| Regulation of lymphocyte activation | GO:0051249 | |
| Cellular response to stimulus | GO:0051716 | |
| Biological regulation | GO:0065007 |
Enriched Hallmarks of Cancer
|
Legend: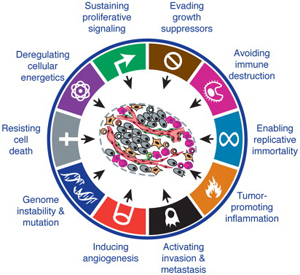 Hanahan and Weinberg, Cell 2011 |