Outline
- About
- Citation
- Constructing gbmSYGNAL network
- Figure 1 - Set enrichment and cMonkey2
- Figure 2 - SYGNAL pipeline and gbmSYGNAL construction
- Figure 3 - Data input and output from SYGNAL pipeline for gbmSYGNAL network
- Combinatorial regulatory interaction network
- Figure 4 - Distribution of number of significant combinatorial interactions
- Supporting references
- Contact Information
About
This website was developed to provides easy access to the gbmSYGNAL network by allowing searching of somatically mutated genes, regulators, or genes in biclusters. In addition there is a veiw of the combinatorial network that also can be used to link through to regulators present in combinatorial reglatory interactions.Citation
Plaisier CL, O'Brien S, Bernard B, Reynolds S, Simon Z, Toledo CM, Ding Y, Reiss DJ, Paddison PJ, Baliga NS. Causal Mechanistic Regulatory Network for Glioblastoma Deciphered Using Systems Genetics Network Analysis. Cell Syst. 2016 Aug;3(2):172-86. doi: 10.1016/j.cels.2016.06.006. PubMed PMID: 27426982; PubMed Central PMCID: PMC5001912.Constructing gbmSYGNAL Network
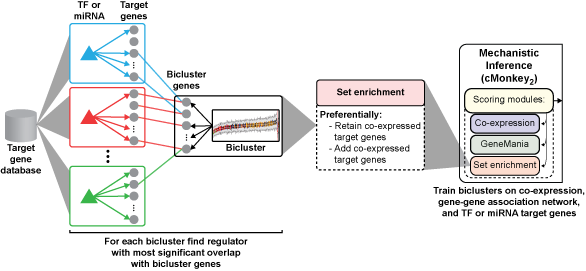
We developed the SYstems Genetics Network AnaLysis (SYGNAL) pipeline to decipher transcriptional regulatory networks from multi-omic and clinical patient data, and applied these tools to 422 patients with glioblastoma multiforme (GBM). The resulting gbmSYGNAL network identified 112 somatically mutated genes or pathways and predicted that these mutations act through 74 transcription factors (TFs; 58 novel) and 37 miRNAs (9 novel) to dysregulate 237 distinct co-regulated gene modules associated with patient survival or oncogenic processes. We have used patient data for glioblastoma multiforme (GBM) to develop the SYstems Genetics Network AnaLysis (SYGNAL) pipeline by integrating the methodology for constructing a mechanistic TF-target gene database with previously developed multi-omics data mining methodologies, including (i) dimensionality reduction by discovering co-regulated gene modules (cMonkey2; Reiss et al., 2015), (ii) inference of mechanistic miRNA regulatory network (Figure 1; framework for inference of regulation by miRNAs (FIRM) integrated into cMonkey2; Plaisier et al., 2012), and (iii) mapping of causal effects from somatic mutations to regulators to their downstream target genes (network edge orienting (NEO); Aten et al., 2008).Figure 1. TF or miRNA-target gene predictions were compiled into a database (TF-target gene database described in A and miRNA-target gene databases are PITA and TargetScan). Mechanistically based TF and miRNA mediated regulation were inferred by integrating the target gene databases into the newly developed set enrichment scoring module for cMonkey2 which systematically retains and adds co-expressed target genes of an enriched regulator.
The SYGNAL pipeline constructs a TRN in three steps (Figure 2): 1) simultaneous dimensionality reduction and mechanistic inference of regulation by a TF of miRNA for a bicluster of genes and conditions (patients are considered conditions in the case of cancer); 2) filter biclusters by validating co-expression and ensuring disease relevance; and 3) causal inference that infers relationships linking somatic mutations to a TF or miRNA to the regulation of a bicluster. We applied the SYGNAL pipeline to multi-omics data from The Cancer Genome Atlas (TCGA) for GBM across 422 patients and 9 normal post-mortem controls to infer an integrated TF and miRNA regulatory network (Brennan et al., 2013). The TCGA multi-omics data were refined at each omic level to enhance the signal-to-noise ratio.
Figure 2. Regulatory influences from target gene databases (this study) and patient tumor data (from The Cancer Genome Atlas (TCGA)) are analyzed sequentially in three steps by a suite of interconnected algorithms in the SYGNAL pipeline. The gbmSYGNAL TRN was constructed by using the SYGNAL pipeline to analyze tumor biopsy data from 422 patients with different subtypes of GBM. The resulting TRN is a predictive map that implicates specific somatic mutations in causally modulating the expression of a TF(s) or miRNA(s) that in turn regulates genes (within a bicluster) that are putatively associated with a hallmark of cancer. A summary of the counts for each feature in the gbmSYGNAL TRN is shown on the left.
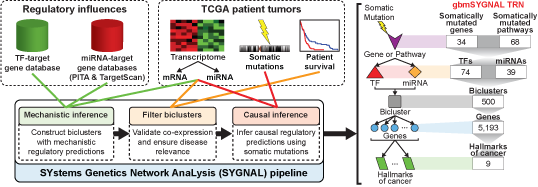
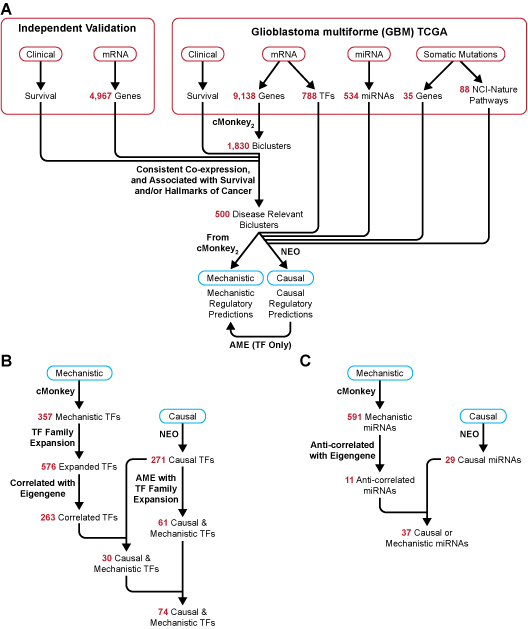
Figure 3. Diagram of flow and input for SYGNAL pipeline and summary of TF and miRNA regulatory predictions for gbmSYGNAL TRN. A. Input data from TCGA and independent validation cohorts were integrated into the SYGNAL pipeline. cMonkey2 was used to reduce dimensionality and discover mechanistic TF and miRNA regulatory predictions. Biclusters were then filtered based on: 1) significant co-expression and validation in at least one independent cohort; and 2) either significant association of bicluster eigengene with patient survival and validation in independent cohort in same direction, or enrichment of the bicluster genes with a hallmark of cancer. Then, NEO was used to infer causal flows of information from a mutation or mutated pathway to a TF or miRNA to a bicluster. The enrichment of a motif in the promoters of bicluster genes was tested using AME and used as a secondary method to discover causal and mechanistic TF regulators. B. Summary of transcription factor (TF) to bicluster regulatory predictions from SYGNAL pipeline and number of TFs discovered at each step. First, cMonkey2 was used to discover mechanistic regulatory predictions. Then each TF was expanded to a list of family members and only those with a significant correlation with the bicluster eigengene were retained. Causal TFs were discovered through NEO. Finally, causal and mechanistic TFs were discovered by overlapping the cMonkey2 and NEO predicted TF regulators or through significant enrichment of causal TF motif instances in the promoters of bicluster genes. C. Summary of miRNA to bicluster regulatory predictions and number of miRNAs discovered at each step. Mechanistic miRNA regulatory predictions were discovered using cMonkey2 and only those miRNAs which were anti-correlated with the bicluster eigengene were retained. Causal miRNA regulators were required to have a negative effect of the miRNA on a bicluster. Finally, causal and mechanistic miRNA regulators were discovered by overlapping the cMonkey2 and NEO discovered miRNA regulators (* overlapping causal and mechanistic miRNAs were not required to be predicted for the same bicluster).
Combinatorial regulatory interaction network
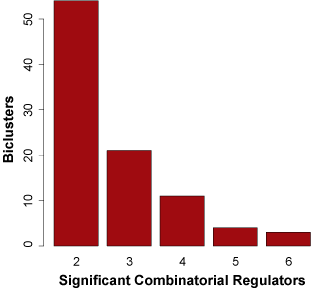
Nearly 40% of all biclusters in the gbmSYGNAL network (93 out of 242 biclusters) were predicted to be under combinatorial control of two or more regulators. Using GBM patient tumor expression data and bidirectional step-wise linear regression we constructed an additive combinatorial regulatory model that best explains the expression for each of the 93 bicluster eigengenes (the first principal component of the co-regulated genes). There was significant evidence that 87 of the 93 biclusters were putatively governed by an additive combinatorial regulatory scheme including two or more regulators (BH-corrected ANOVA p-value = 0.05). Of the 87 additive combinatorial models of bicluster regulation, 58 included two regulators, 17 included three regulators, 10 included four regulators, and 2 included five regulators. In the combinatorial models there were 54 TFs and 31 miRNAs that integrated into 45 TF-TF, 17 miRNA-miRNA, and 25 TF-miRNA combinatorial regulatory interactions (Figure 3A). The 54 TFs in the combinatorial models include 23 of the 26 TFs in the gbmSYGNAL network with significantly altered proliferation in glioma stem cell isolate CRISPR-Cas9 knock-outs (p-value = 4.6 x 10⁻³), and all 13 TFs with glioma specific proliferation effects (p-value < 2.2 x 10⁻¹⁶). Which demonstrates that a majority of the TFs involved in combinatorial regulatory interactions are functional and disease relevant. Additionally, 44% of TF-TF, miRNA-miRNA and TF-miRNA pairs within combinatorial models had significant binding site co-occurrence within the corresponding regulatory regions (promoter or 3' UTR) of bicluster genes (BH-corrected p-value = 0.05). This demonstrates that the predicted combinatorial regulators are directly interacting with regulatory regions of the same genes and thereby mediating their co-expression. The ability of the SYGNAL pipeline to uncover combinatorial regulatory interactions not only provides deeper understanding of GBM etiology but also it enables strategies for combinatorial interventions.Figure 4. Distribution of number of combinatorial regulatory interactions for signficiant biclsuter additive models.
Supporting References
-
TCGA data
- TCGA GBM - Brennan et al., 2013
- cMonkey2 - Reiss et al., 2015
- FIRM - Plaisier et al., 2012
- NEO - Aten et al., 2008
- MEME SUITE (MEME, TOMTOM, FIMO) - Bailey et al., 2009
- AME - McLeay et al., 2010
- JASPAR - Mathelier et al., 2014
- SELEX - Jolma et al., 2013
- TRANSFAC - Matys et al., 2006
- UniPROBE - Newburger and Bulyk, 2009
- UCSC hg19 Genome Sequences - hg19 Masked Fasta Files
- Gene Definitions - RefGene File
SYGNAL pipeline algorithms
Motif Repositories
Genome Data